GreenCode Hackathon team project
SmartWater Zambia
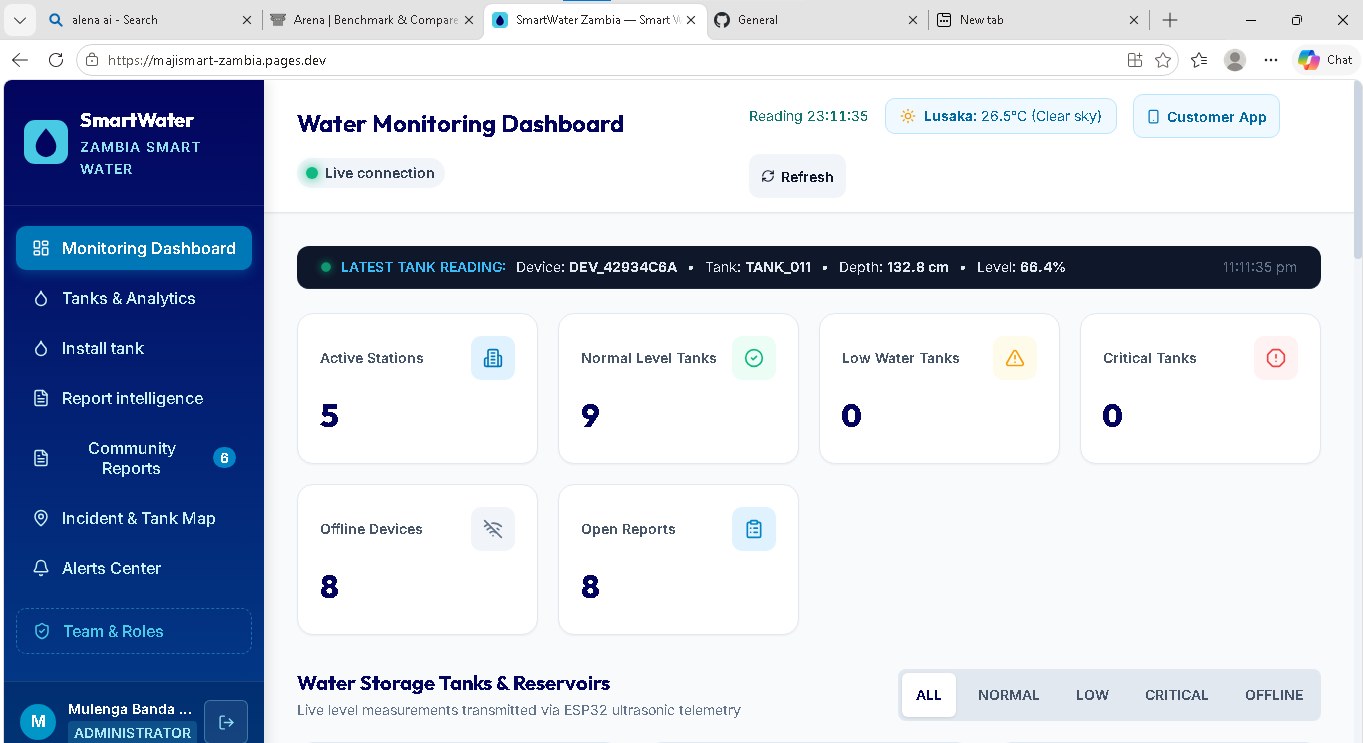
Water level sensors, an operator dashboard and a community reporting app, built as one system during the GreenCode Hackathon.
- Role
- Full-stack developer: web dashboard, Android app and API
- Status
- Top 6 team · working prototype
- Year
- 2026
- Stack
- Kotlin · Jetpack Compose · React · Vite · Node.js · Express · Supabase · PostgreSQL · Server-Sent Events · ESP32
01 · Context
The problem
Zambian utilities keep instrumentation at treatment works and district meters but very little between the district meter and the customer, so leaks and shortages surface as phone calls and reconciled bills days later. Residents have no dependable signal for how much water is actually in a shared tank, and incident reports arrive without consistent categories, locations or a record of what was checked.
The response
SmartWater Zambia puts three layers on one data contract: an ESP32 ultrasonic sensor posts calibrated readings to an authenticated API, an operator dashboard tracks levels, alerts and community reports in real time, and a native Android app gives residents the same picture plus a route onto the incident map.
02 · Contribution
What I built
- 01
Built the Express API behind the platform: JWT role authentication plus per-device API keys, IoT ingestion, threshold alerting, heartbeat and offline detection, and a Server-Sent Events hub with a polling fallback.
- 02
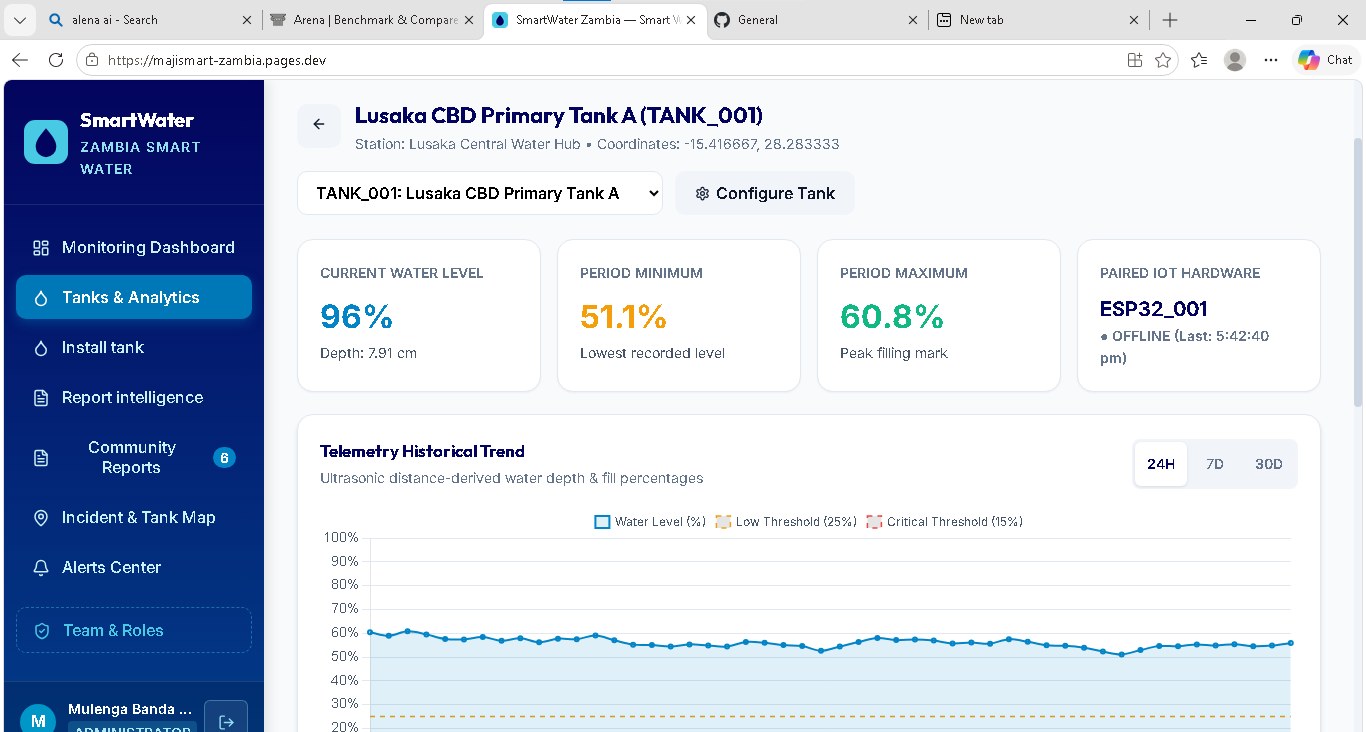
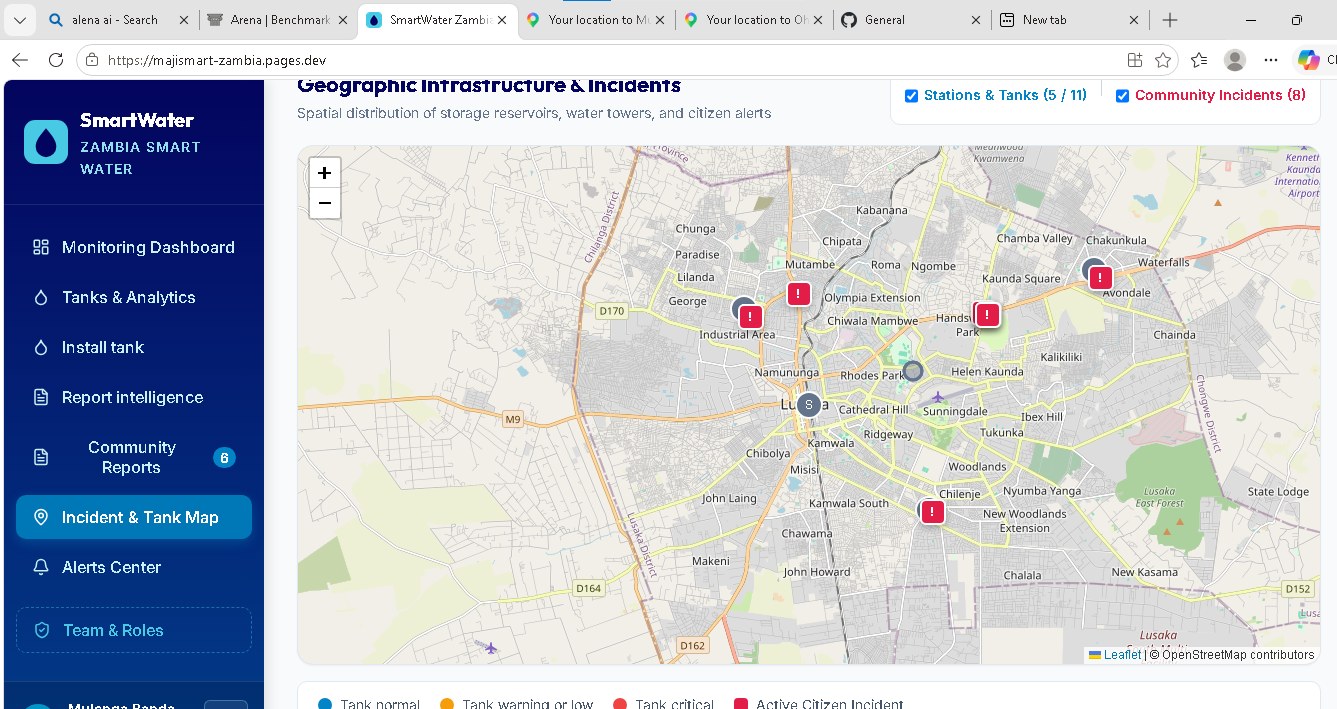
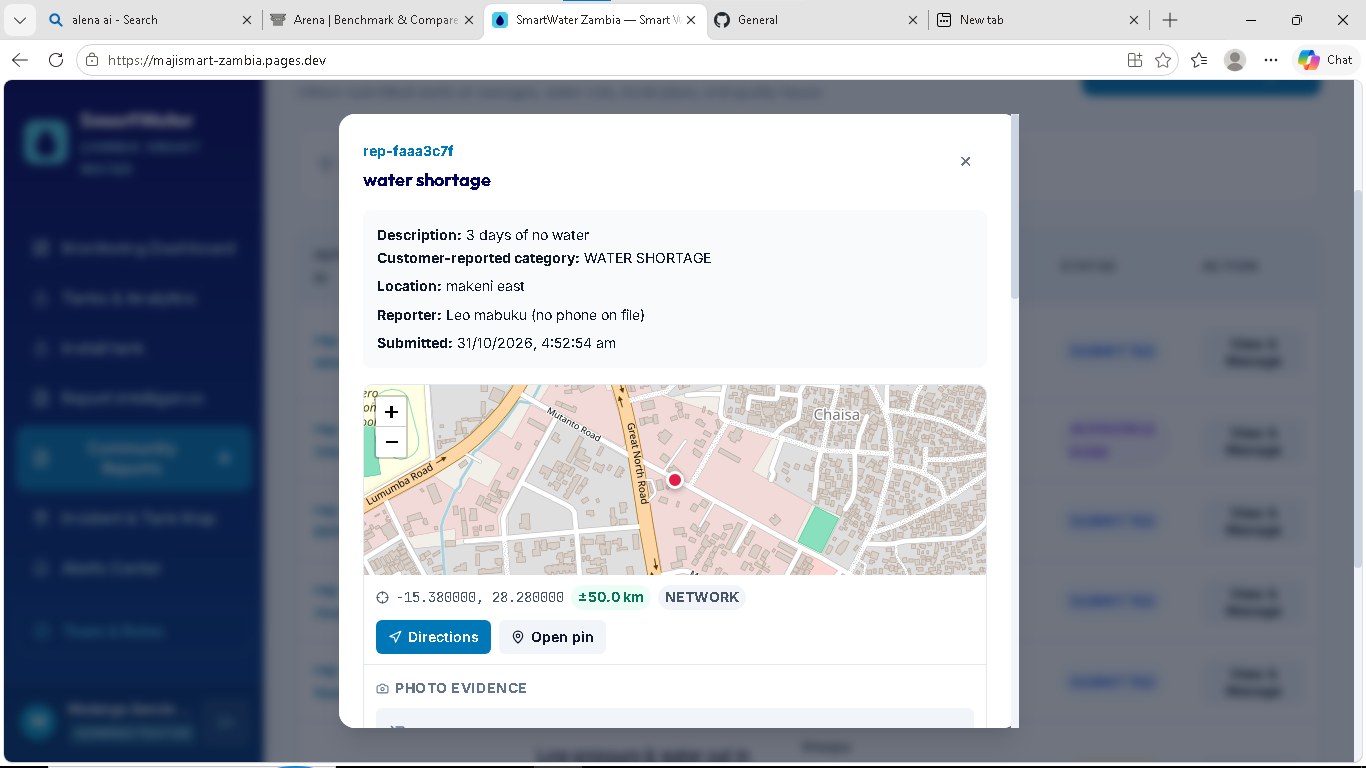
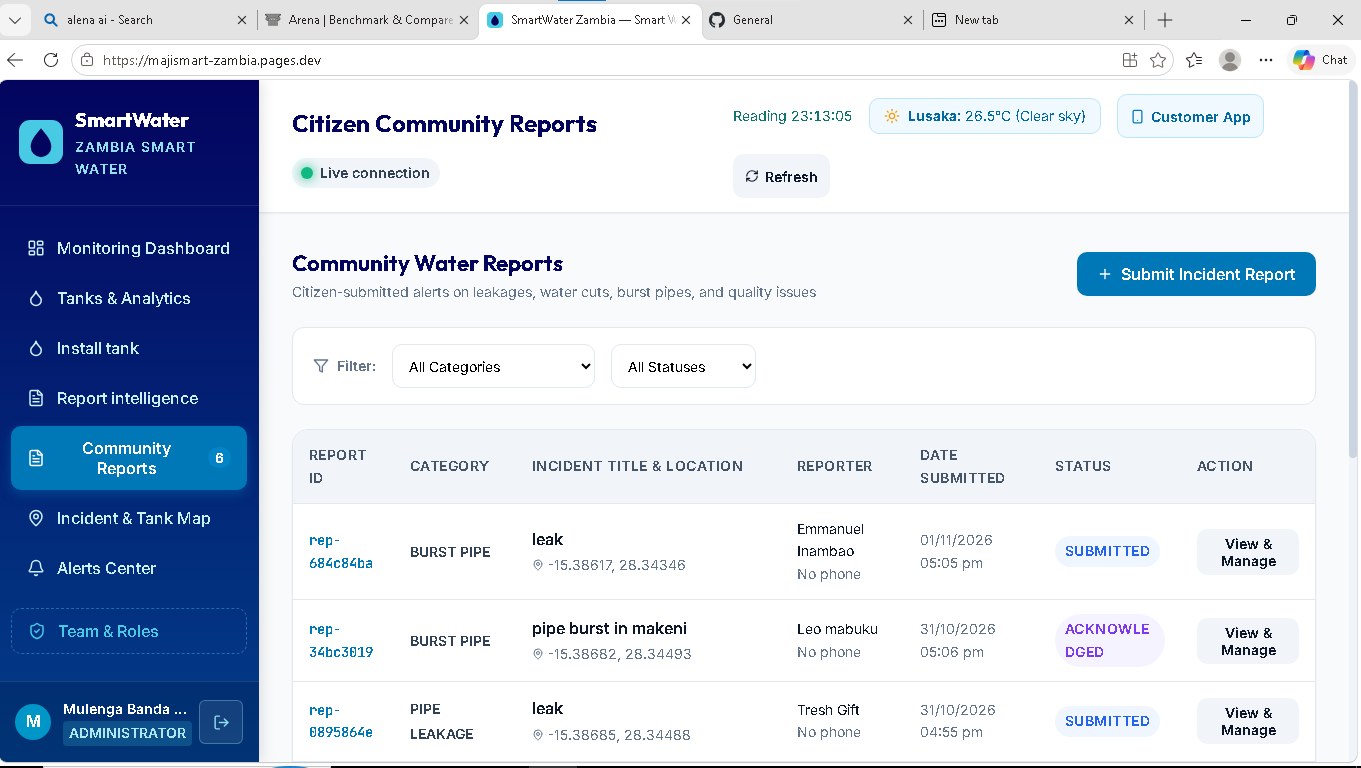
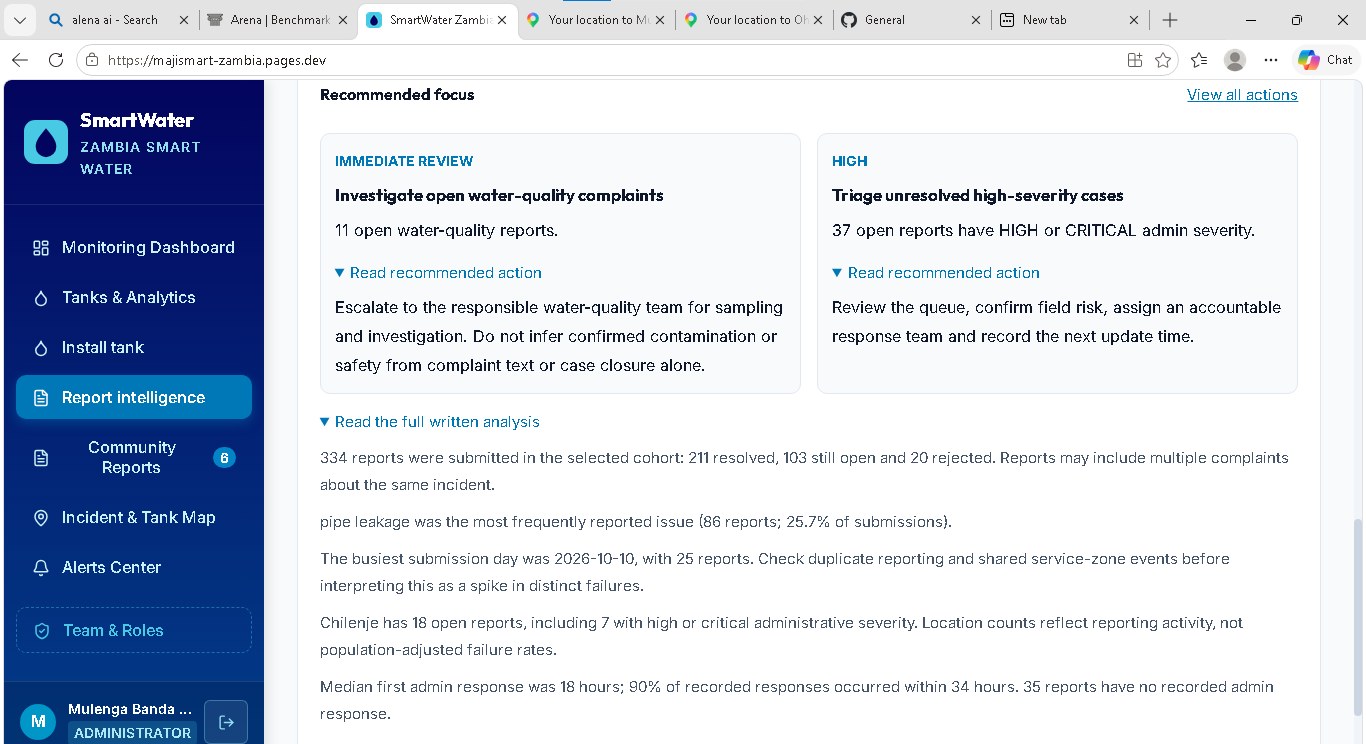
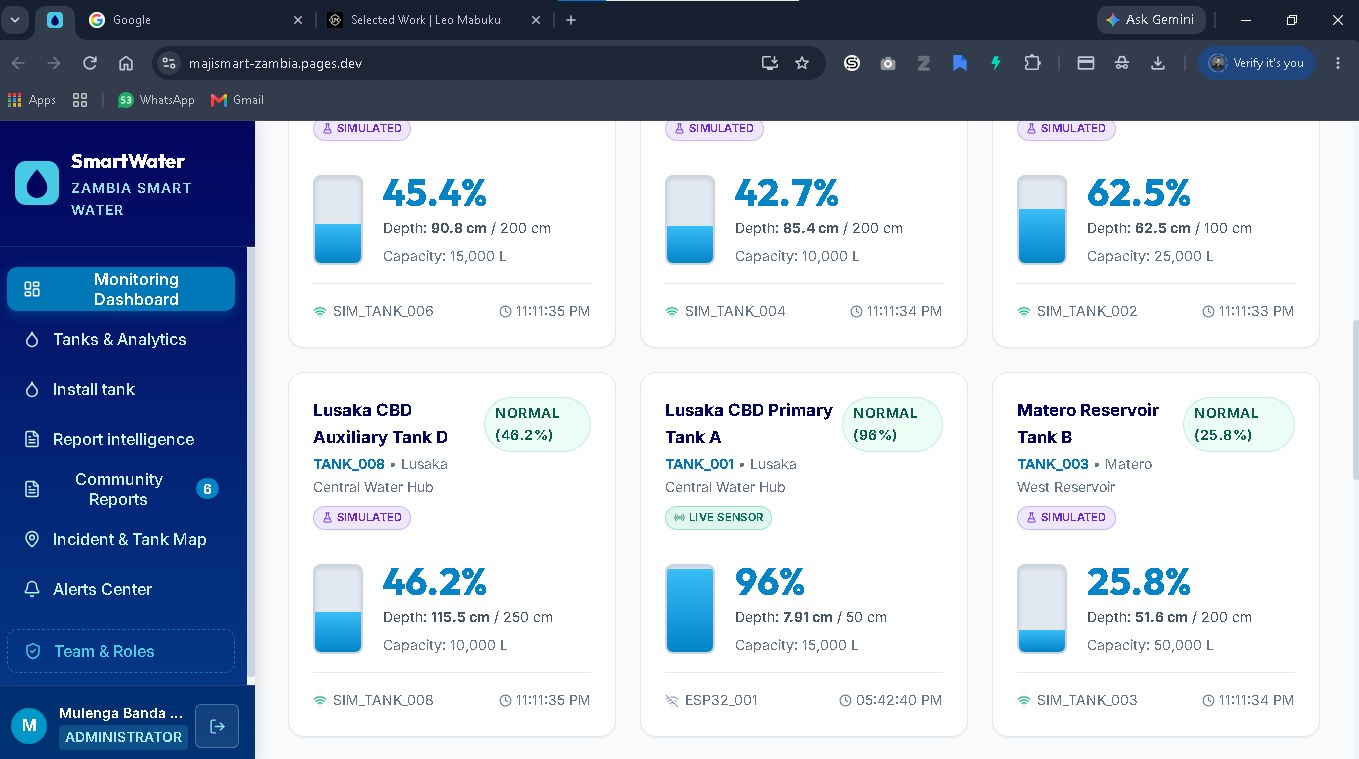
Built the React administration dashboard: live tank cards, Chart.js history, a Leaflet incident map, community report case management and analytics, the alerts centre, the hardware simulator and the installation and calibration screens.
- 03
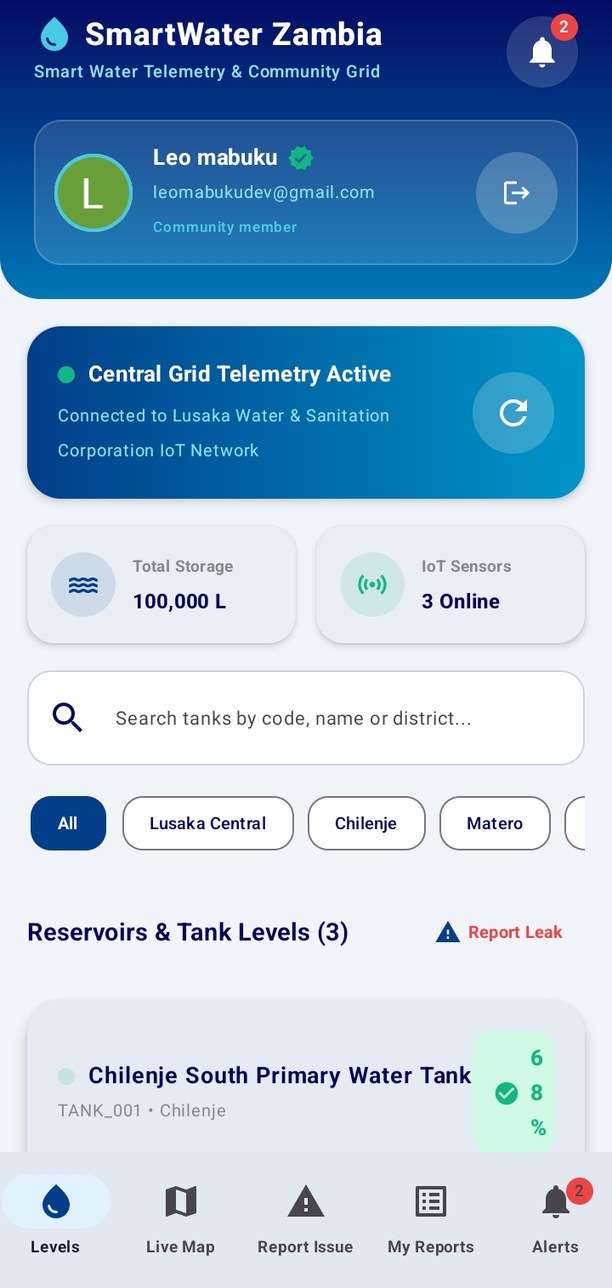
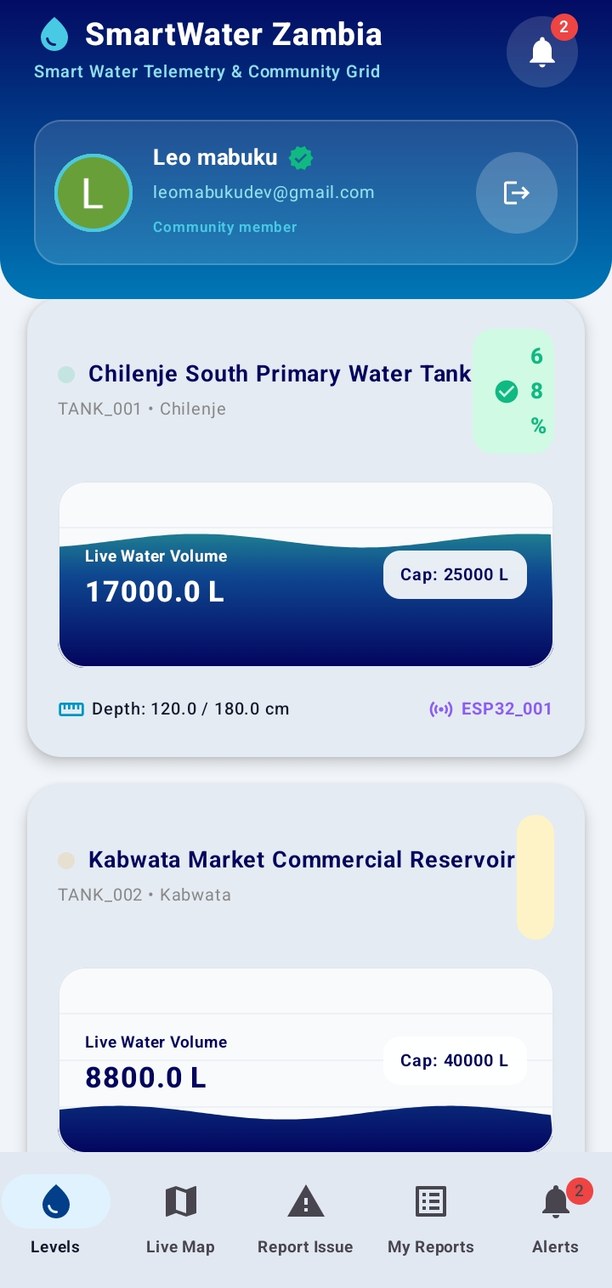
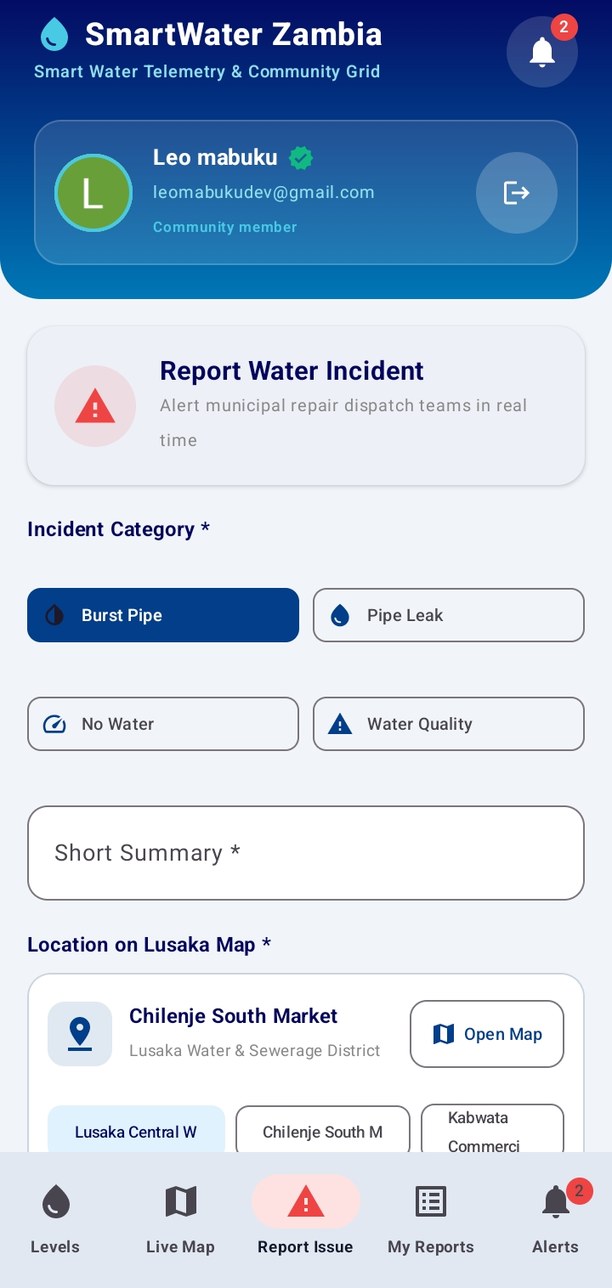
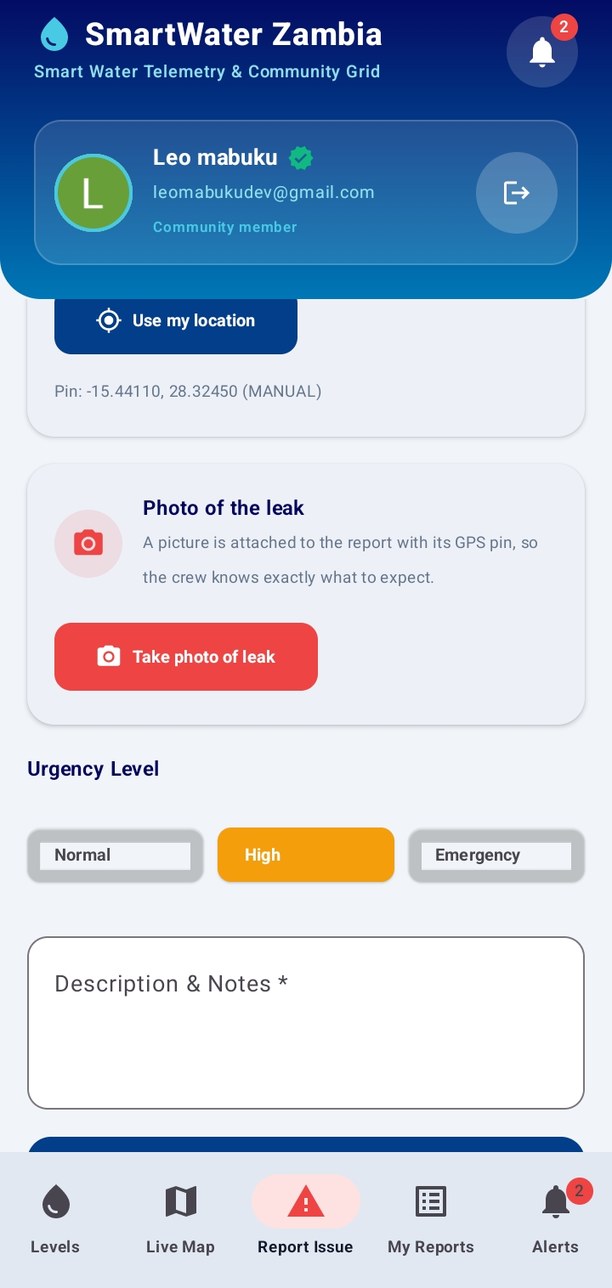
Built the native Android customer app in Kotlin and Jetpack Compose: live level gauges, saved locations, map-based report submission, notifications and Google sign-in.
- 04
Wired the physical demo: one ESP32 ultrasonic sensor on a real tank streaming into the same API the dashboard and app read, with the remaining tanks simulated so the operator view could be shown at realistic scale.
03 · What it does
What it does
today.
04 · Who it is for
The people
it serves.
Commercial water utilities
Zambia’s eleven commercial utilities and six private schemes hold instrumentation at treatment works and district meters, and very little between that and the customer. This targets exactly that gap: storage visibility plus a queue of citizen-reported incidents carrying a location and a photo.
Institutions with stored water
Campuses, hospitals, boarding houses, hotels, mines and commercial farms all store water in tanks someone has to walk to and read. A sensor and a dashboard replace that trip with a timestamped number and an alert.
Landlords and estate managers
Buildings with per-block storage can see level and consumption per tank, and route tenant complaints into one case history instead of scattered phone calls.
WASH programmes and funders
Programmes need verifiable reporting on what was installed, what was measured and what was fixed. The installation, calibration and case-history records exist to produce that trail.
Residents
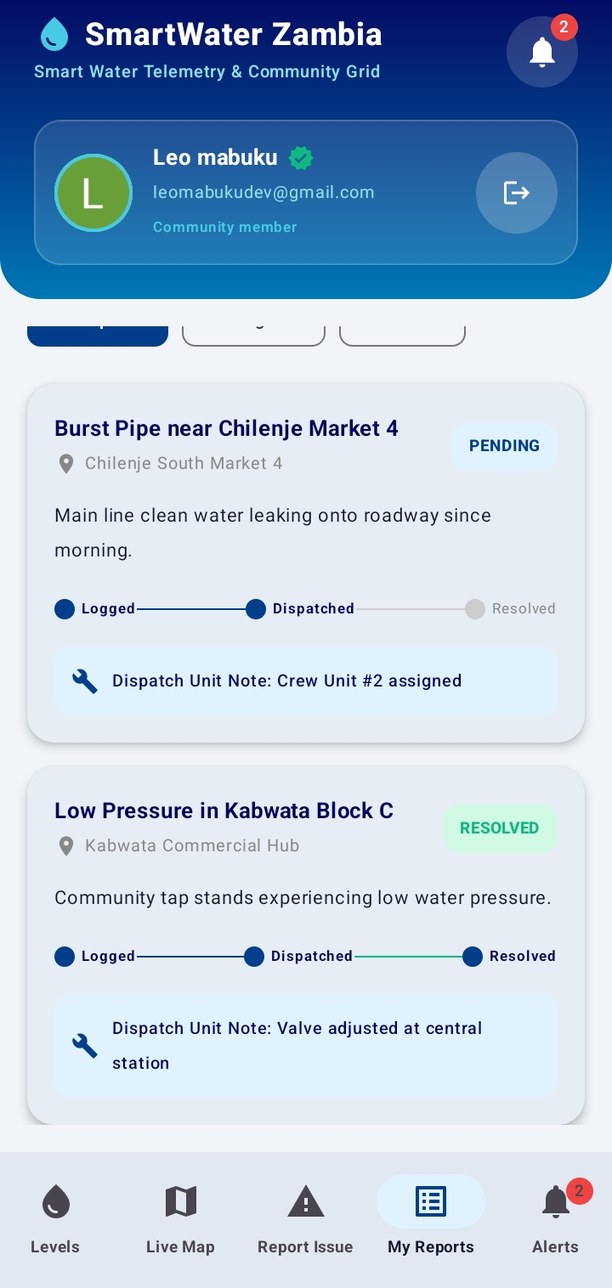
The people at the end of the pipe are beneficiaries rather than buyers: see the level in your own tank, report a burst pipe with a pin and a photo, and follow the case to resolution.
Current limits, stated plainly
One physical ESP32 sensor was connected at the hackathon and monitored a real tank (TANK_001, the tank used in the live demo). Additional tanks and stations were simulated so the operator view could be shown at realistic scale, and every simulated record is labelled as such in the interface.
Report-intelligence figures in these captures come from a seeded demo cohort, not a live utility dataset.
Calibration against manual measurements, production deployment and utility integration are still to be done.
05 · Screens
See it
working.
Screenshots and recordings from the real build, with the notes that belong to them.
06 · Why it matters
A market measured in
money, not litres.
- Sector non-revenue water reached 57% in 2023 against a regulator benchmark of under 20% for good performance. No Zambian utility is close.
- The water that is billed costs about K12.61 per unit to deliver and sells for an average of K7.90, and all eleven utilities sit below 100% cost coverage by collection.
- The national strategy put revenue lost to non-revenue water at ZMW 998.6 million on a 2020 baseline, against a benchmark loss of ZMW 474.5 million.
- Lusaka produced roughly 350,000 m³/day against 480,000 m³/day of demand, dropping to about 265,000 during the 2025 drought. When supply is intermittent, knowing the tank level stops being a nicety.
- Roughly 8.36 million people live inside commercial-utility service areas, and coverage fractions fell as population grew faster than connections. Utilities are running to stand still without better information at the edge.
07 · Engineering
Hard parts,
clear decisions.
Telemetry that does not invent data
A sensor timeout, a bad reading and a genuinely empty tank look similar from a distance. The platform records sensor faults as their own event, flags stale readings instead of repeating the last value, and labels every simulated tank so an operator can separate what was measured from what was seeded.
One contract, three clients
Firmware, dashboard and Android app had to agree on distance, depth, level and volume while the device side stayed minimal. Calibration and geometry live on the server, so the ESP32 posts centimetres and both clients read the same derived state over REST and SSE.
A 48-hour build that still behaved like a system
The stack ran on SQLite locally and Supabase PostgreSQL in deployment, so every schema change had to survive both; realtime used SSE with a polling fallback, because a dropped stream must not look like a tank that stopped changing.
08 · Path to production
What it takes
to run for real.
- 01
Field calibration: run the recorded empty/full reference protocol against a physical tank and log the error, because an uncalibrated ultrasonic reading is a guess with a timestamp.
- 02
Hardware hardening: enclosure, power, sensor dead zones and per-device provisioning at scale.
- 03
Security review before exposure: server-side enforcement instead of relying on row-level security alone, authenticated realtime streams and credential rotation.
- 04
Integration with the systems utilities already run, such as billing and district metering, so a reading turns into revenue or a work order instead of another dashboard.
- 05
Channels that match the user: SMS and USSD paths for residents without smartphones, alongside the Android app.
- 06
A pilot with one institution or one utility zone, with a baseline, a measured outcome and an exit decision.
09 · Reflection
What I learned
Planned or still in development
- Field calibration of the sensor against manual measurements
- Per-device provisioning at utility scale
- SMS and USSD channels for residents without smartphones
- Integration with utility billing and district-metering systems
Where it stands
The repository holds the ESP32 firmware, the Express and Supabase API, the React dashboard and the Kotlin Android app, along with the backend and web test suites. We finished in the top six at the GreenCode Hackathon Zambia Edition.
Built at the GreenCode Hackathon · Zambia Edition, 30 Oct – 1 Nov 2026 in Lusaka, Zambia. Result: top 6 team. Built at the GreenCode Hackathon Zambia Edition, run by Garage48 and BongoHive with ESTDEV, in Lusaka from 30 October to 1 November 2026. Thank you to the organisers for putting a hundred Zambian developers, designers and sustainability practitioners in one room with a real brief and real mentors; to the mentors and judges who pushed every team to validate before building; and to the six-team follow-on programme that gives this prototype a route beyond the weekend. Finishing in the top six is an opportunity rather than a trophy. The plan is to keep going: calibrate the hardware, harden the platform and put SmartWater Zambia in front of a Zambian utility or institution as a paid pilot.
The code